Coastline Paradox: Seven Rulers, Seven Lengths for Britain
TL;DR: A 200 km ruler measures Britain's coast at 2,508 km; a 3.125 km ruler measures 6,579 km. On Natural Earth's 1:10m map of Great Britain's main island, every halving of the ruler from 200 km down to 3.125 km gave a longer coast, so on this map the length depends on the ruler you pick.
Rule: Walk a fixed ruler along the coast; shorter steps catch more bends.
Narrow screen? Scroll the drawing sideways, or open it full size.
Full credit to copy
"Great Britain walked with a 200 km ruler" by Drawn Mathematics, https://drawnmathematics.com/fractals/coastline-paradox/, licensed under CC BY 4.0, https://creativecommons.org/licenses/by/4.0/
Step 1: walk Britain with a 200 km ruler
The coastline paradox is this: measure a coast with a shorter ruler and it comes out longer, so a coastline has no single length until you name the ruler. Husain and colleagues, writing in Scientific Reports in 2021, say the answer depends on "how long is your measuring stick". Watch it happen on one map in four steps.
The map here is Great Britain's main island from Natural Earth version 5.1.2, a public-domain world map drawn for a scale of 1:10 million. Natural Earth's notes say its ocean coastline comes mainly from World Data Bank 2, with modest generalization by line simplification. The island is one closed line of 3,706 points, with no offshore islands. The notes read for this page name no tide level for the line.
Narrow screen? Scroll the drawing sideways, or open it full size.
Full credit to copy
"Where each 200 km step lands" by Drawn Mathematics, https://drawnmathematics.com/fractals/coastline-paradox/, licensed under CC BY 4.0, https://creativecommons.org/licenses/by/4.0/
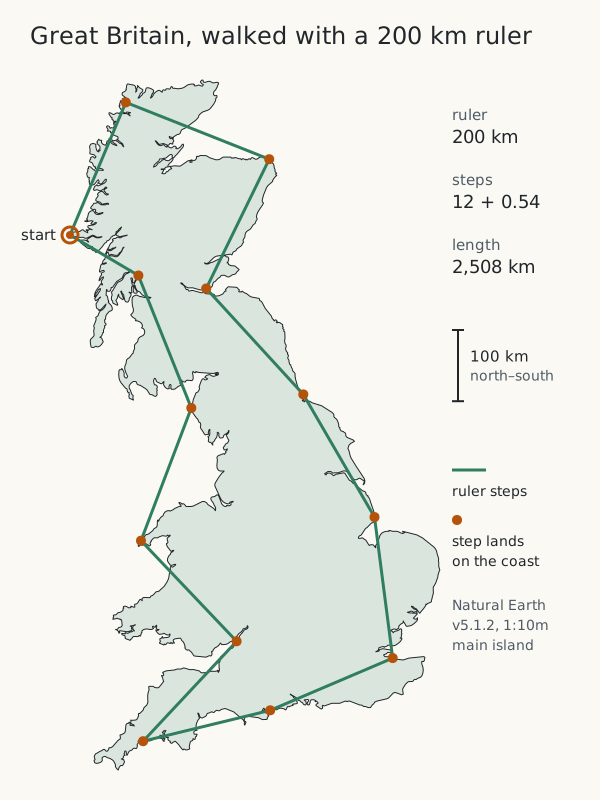
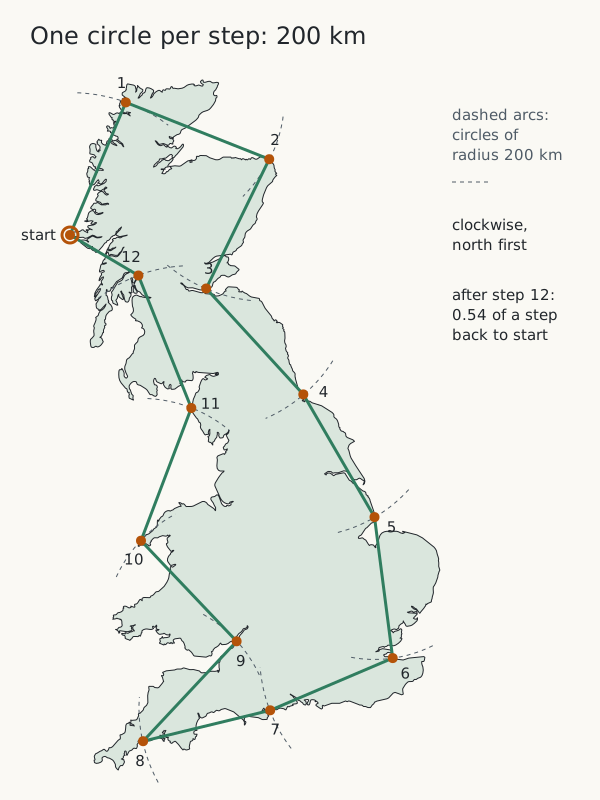
Open a pair of dividers to 200 km and put one point on the outline's westernmost point, at 6.24° W, 56.72° N. Swing the other point clockwise, north first, until it first touches the coast ahead. That touch is step 1; move the first point there and repeat. Each distance is measured on the Earth's surface, on the WGS84 ellipsoid, not across a flat drawing.
Twelve full steps bring the dividers back near the start, with 0.54 of a step left over. So the 200 km walk measures 12.54 × 200 = 2,508 km. The walks on this page are illustrative measurements, computed with a short program that finds, between two data points, the exact spot one ruler length from the last landing point.
Steps 2 and 3: halve the ruler, then halve it again
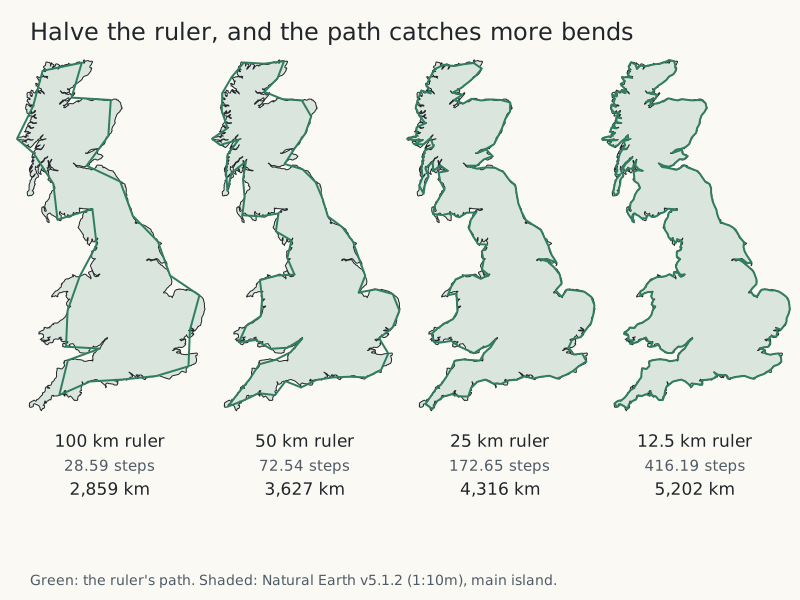
Halve the opening to 100 km and walk again from the same start. The path cuts fewer corners, and the count rises to 28.59 steps, or 2,859 km. Halve it to 50 km, then 25 km, then 12.5 km. Each time, the path tucks into bays and around headlands it skipped before.
Narrow screen? Scroll the drawing sideways, or open it full size.
Full credit to copy
"The outline walked with 100, 50, 25 and 12.5 km rulers" by Drawn Mathematics, https://drawnmathematics.com/fractals/coastline-paradox/, licensed under CC BY 4.0, https://creativecommons.org/licenses/by/4.0/
| Ruler | Steps | Measured length | Change from the ruler twice as long | Times the 200 km length | Map measured |
|---|---|---|---|---|---|
| 200 km | 12.54 | 2,508 km | first walk | 1.00 | Natural Earth 1:10m, main island |
| 100 km | 28.59 | 2,859 km | +14.0% | 1.14 | Natural Earth 1:10m, main island |
| 50 km | 72.54 | 3,627 km | +26.9% | 1.45 | Natural Earth 1:10m, main island |
| 25 km | 172.65 | 4,316 km | +19.0% | 1.72 | Natural Earth 1:10m, main island |
| 12.5 km | 416.19 | 5,202 km | +20.5% | 2.07 | Natural Earth 1:10m, main island |
| 6.25 km | 960.21 | 6,001 km | +15.4% | 2.39 | Natural Earth 1:10m, main island |
| 3.125 km | 2,105.19 | 6,579 km | +9.6% | 2.62 | Natural Earth 1:10m, main island |
Every halving adds length. From 200 km down to 12.5 km, each halving adds between 14% and 27%, and the 12.5 km ruler measures about twice what the 200 km ruler did. The last two rows behave differently, and the section on where the rule stops explains why.
The CSV file lists every ruler with its step count, length, start point and data source: coastline-paradox-ruler-walk.csv (CSV; where this file comes from: source, version and license, JSON) Source data: Computed for this page from Natural Earth v5.1.2, 1:10m coastline (ne_10m_coastline), public domain
Step 4: read the slope on a log-log plot
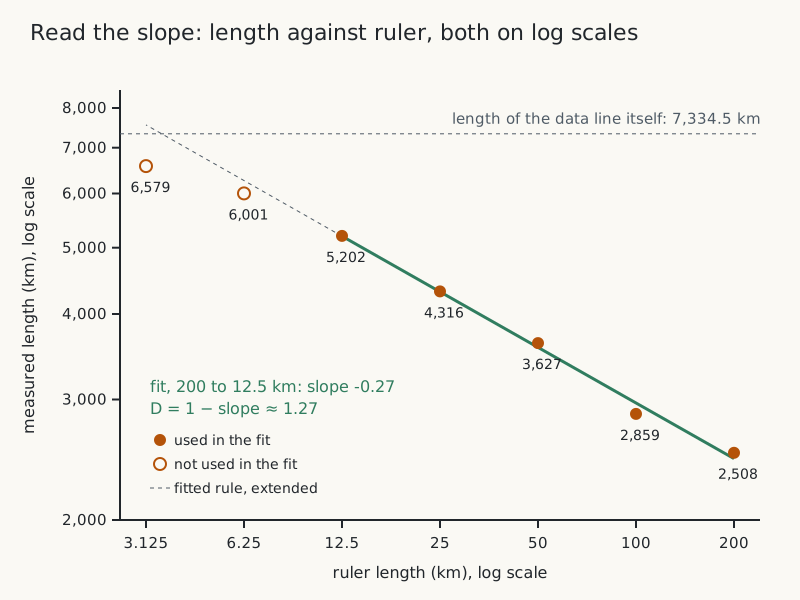
Plot each measured length against its ruler on log-log axes, where equal distances along an axis stand for equal multiples. Husain and colleagues write Richardson's divider rule as L = k × ε^α: the measured length L is a constant k times the ruler length ε raised to a power α. A power law like that turns into a straight line on log-log axes, and its slope α equals 1 − D. They call D the divider dimension.
Narrow screen? Scroll the drawing sideways, or open it full size.
Full credit to copy
"Measured length against ruler length, log-log" by Drawn Mathematics, https://drawnmathematics.com/fractals/coastline-paradox/, licensed under CC BY 4.0, https://creativecommons.org/licenses/by/4.0/
Fit a straight line to the five rulers from 200 km to 12.5 km. Its slope is −0.27. That puts D at about 1.27 for this outline over that range. At that slope, each halving of the ruler multiplies the length by 2 to the power 0.27, which is about 1.21, or 21% more.
To see what a dimension like 1.27 means, start with a smooth curve, which has D = 1: once the ruler is short enough, a shorter one adds almost nothing. Husain and colleagues give coastline dimensions as values between 1 and 2, with higher values for more irregular coasts. A D of 1.27 describes how fast this outline gains length between 200 km and 12.5 km, and nothing outside that range.
What Richardson and Mandelbrot reported
Full credit to copy
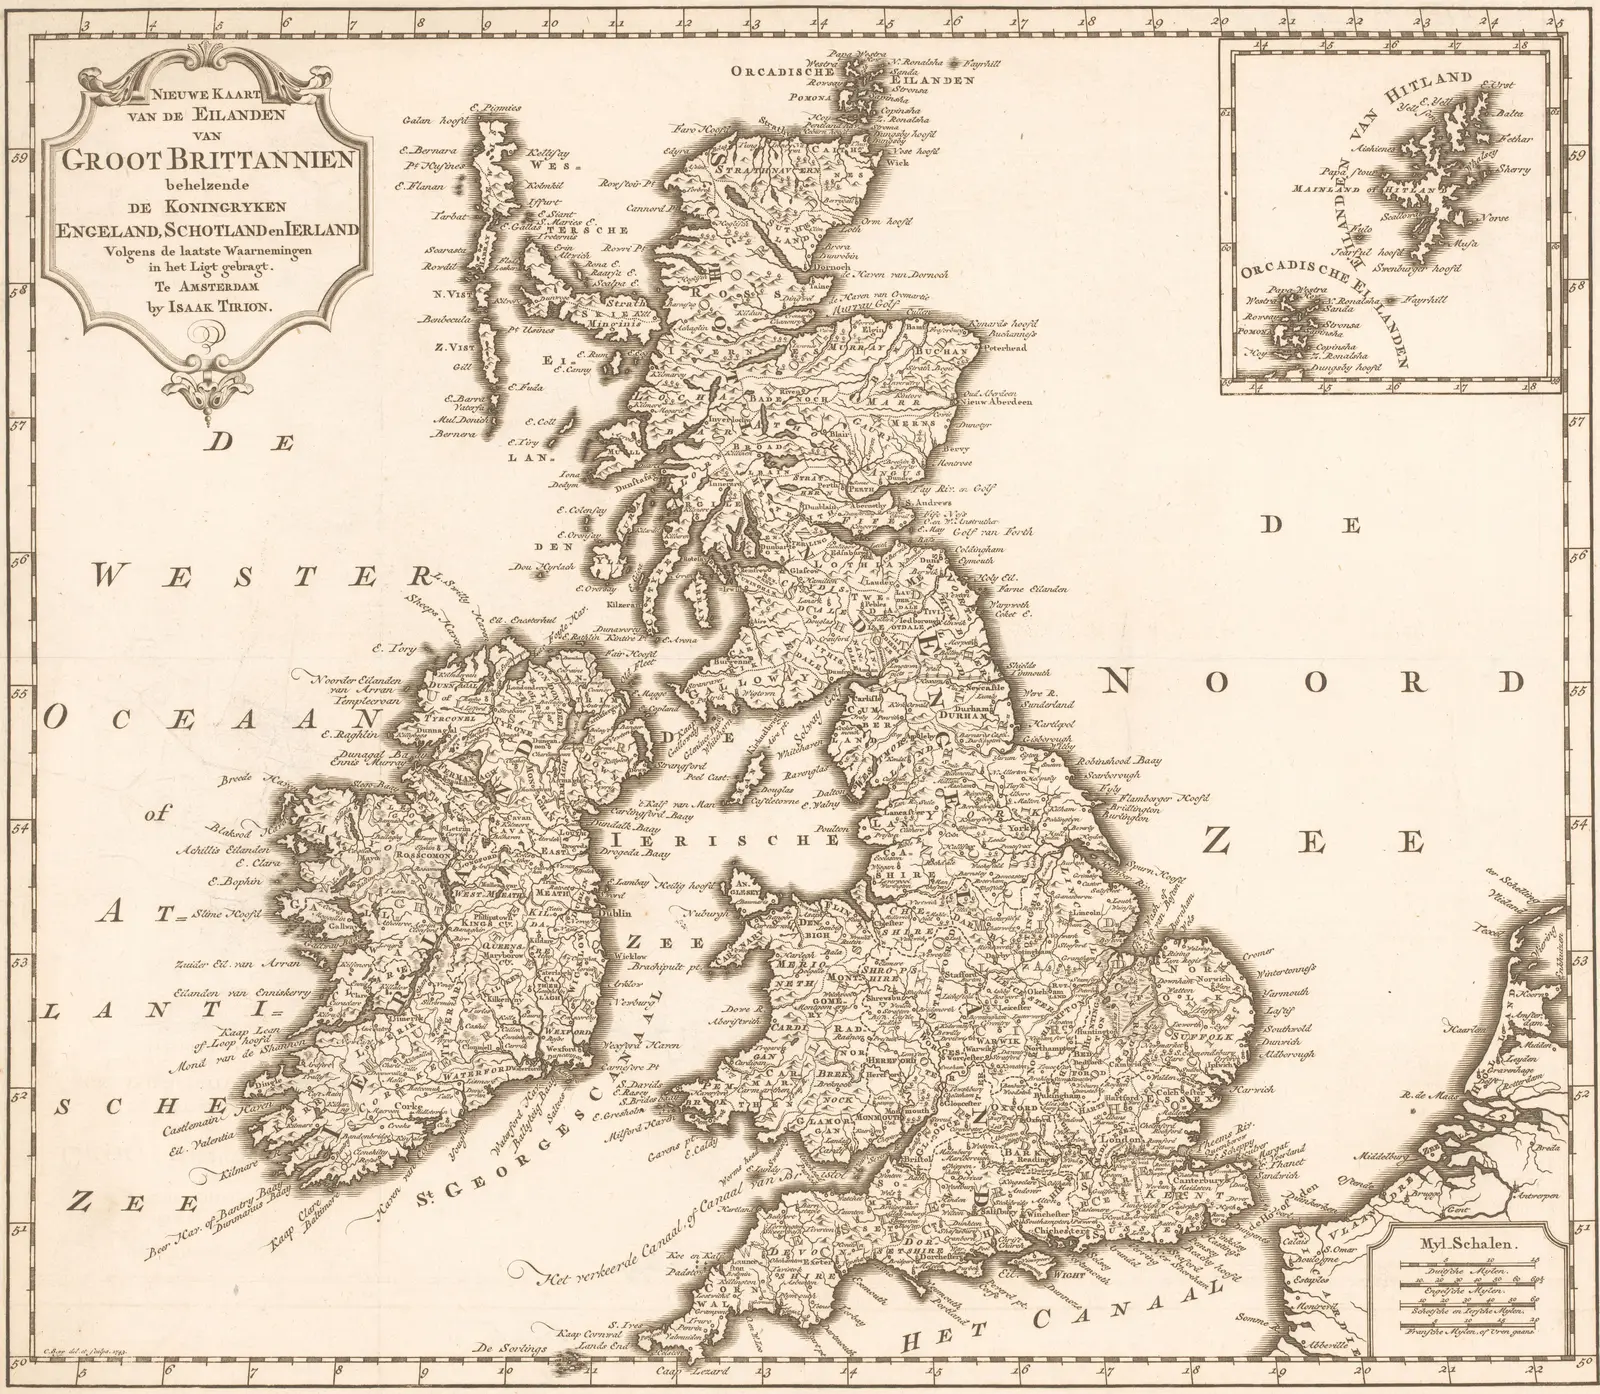
"Kaart van Groot-Brittannië en Ierland" by Christiaan Sepp, published by Isaak Tirion — https://commons.wikimedia.org/wiki/File:Kaart_van_Groot-Brittanni%C3%AB_en_Ierland,_RP-P-1937-1763.jpg — Public domain (printmaker Christiaan Sepp (c. 1720–1775) and publisher Isaak Tirion (1705–1769), dates per Library of Congress name authorities; published in Amsterdam in 1743; PD worldwide (US: published before 1930; EU: the makers died more than 70 years ago); museum image released into the public domain by the Rijksmuseum (RP-P-1937-1763; CC0 on Commons)); modified: cropped to just outside the engraved border, removing the paper margins and a pencilled inventory number; colours not altered
The map above was published in Amsterdam in 1743 by Isaak Tirion and engraved by Christiaan Sepp after his own drawing, according to the Rijksmuseum's record. It is here as history only. Nothing on this page was measured on it.
Husain and colleagues describe how Lewis Fry Richardson measured coastlines, Great Britain's among them, by walking dividers of a fixed opening along the coastline and multiplying the count by the opening. They cite his 1961 paper "The problem of contiguity" and summarise his slopes in a table, with Benoit Mandelbrot's reading of each slope as a dimension.
| Line measured | Slope (Richardson) | D (Mandelbrot) | Where this row comes from |
|---|---|---|---|
| West coast of Britain | −0.25 | 1.25 | Husain et al. 2021, Table 1 |
| Land frontier of Germany | −0.15 | 1.15 | Husain et al. 2021, Table 1 |
| Land frontier of Portugal | −0.14 | 1.14 | Husain et al. 2021, Table 1 |
| Coastline of Australia | −0.13 | 1.13 | Husain et al. 2021, Table 1 |
| Coast of South Africa | −0.02 | 1.02 | Husain et al. 2021, Table 1 |
Mandelbrot's 1967 paper in Science, "How Long Is the Coast of Britain? Statistical Self-Similarity and Fractional Dimension", says in its abstract that geographical curves are so involved in their detail that their lengths are "often infinite or, rather, undefinable". The abstract adds that many such curves are statistically self-similar, each part a smaller-scale copy of the whole, and describes them with a fractional dimension D above 1.
This page's 1.27 is not a check on the 1.25 in the table. The table's figure is for Britain's west coast as Richardson measured it. This page's covers the whole main island on Natural Earth's generalized line.
So how long is Britain's coastline? There is no single number to quote. Every figure comes with a ruler and a map, and on Natural Earth's 1:10m map alone the seven rulers give anywhere from 2,508 km to 6,579 km.
Husain and colleagues report a similar gap for Australia. By their account, a divider survey on 162 maps by Galloway and colleagues found 47,070 km including islands, while another figure they cite is 59,681 km. They put the difference down to rulers of different sizes.
Where the rule stops on this map
Keep halving and the gains shrink. At 6.25 km the walk measures 6,001 km, 15.4% more than at 12.5 km. At 3.125 km it measures 6,579 km, only 9.6% more. The fitted rule from Step 4 predicted 6,268 km and 7,558 km.
The second prediction is impossible on this file. Add up the straight pieces between neighbouring data points and the whole line is 7,334.5 km long. No walk can measure more than that, because each step is a straight cut across a stretch of the line and is never longer than the stretch it cuts.
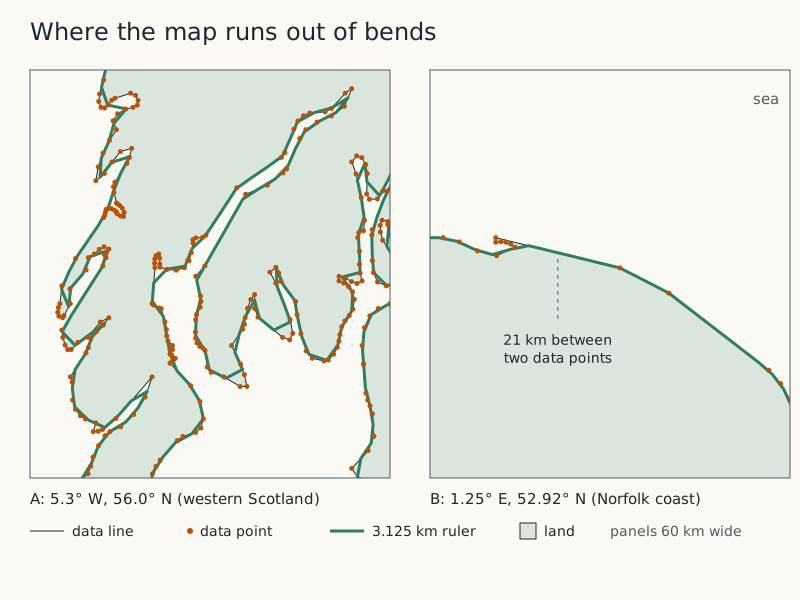
Narrow screen? Scroll the drawing sideways, or open it full size.
Full credit to copy
"Data points and the 3.125 km walk on two stretches of coast" by Drawn Mathematics, https://drawnmathematics.com/fractals/coastline-paradox/, licensed under CC BY 4.0, https://creativecommons.org/licenses/by/4.0/
The data points sit 1.4 km apart at the median. Along smooth stretches the map uses long straight edges, five of them over 20 km. In all, 41.5% of the line's length lies in edges longer than 3.125 km. Along such an edge, every ruler shorter than the edge walks the same straight line, so the short rulers find no new bends there.
Is a coastline infinitely long? On a map, no: this one cannot measure more than 7,334.5 km. Richardson saw real coasts keep growing as the ruler shrank, instead of settling toward a limit, as Husain and colleagues summarise his work. They also describe coastlines as similar across scales "at least for some range", so the divider rule describes a measured range, not every scale.
A coast with no bottom: the Koch curve
Narrow screen? Scroll the drawing sideways, or open it full size.
Full credit to copy
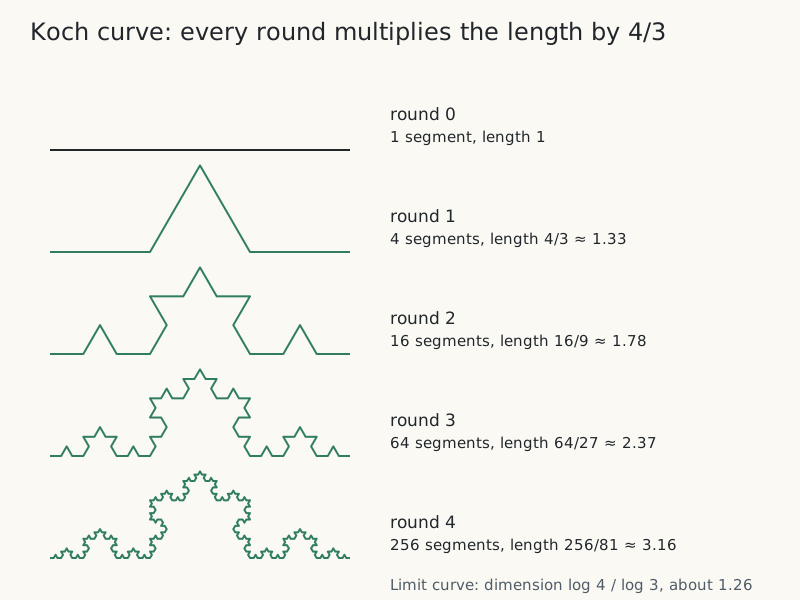
"Koch curve, rounds 0 to 4" by Drawn Mathematics, https://drawnmathematics.com/fractals/coastline-paradox/, licensed under CC BY 4.0, https://creativecommons.org/licenses/by/4.0/
Draw a straight segment and cut it into thirds. Replace the middle third with two sides of an equilateral triangle that points outward. Repeat on every segment. Each round turns one segment into four segments a third as long, so each round multiplies the length by 4/3.
Rounds 1 to 4 give 4/3, 16/9, 64/27 and 256/81 of the starting length, about 1.33, 1.78, 2.37 and 3.16. After 10 rounds the curve is about 17.8 times as long as the segment it started from. Every round keeps the corners of the round before, and the limit curve runs through all of them, so it is longer than any round: its length is infinite, and its dimension is log 4 / log 3, about 1.26. Three Koch curves around a triangle make the closed curve called the Koch snowflake, which von Koch first described in 1904, by MathWorld's account.
Each drawing is the rule, caught in the act at a different round. Every piece in one round becomes four pieces, each a third the size, in the next. For another shape built from exact copies of itself, see Sierpinski Triangle: A Dice Game Draws It Dot by Dot.
Keep three things apart. The Koch curve is a mathematical limit with no bottom. This page's walk is a finite measurement on a map that has a smallest bend. A real coast follows the divider rule only across the ruler lengths someone has measured, and the page on checking the construction keeps the same three layers apart.
Draw it yourself:
With paper and a few simple tools
- Print the outline at the top of this page on A4, or trace a stretch of coast from any printed map.
- Open a pair of dividers to the 100 km bar on the drawing. Walk them clockwise around the coast from the start and count the steps. Hold the dividers by the hinge with both points on the paper, away from your fingers; children should use them with an adult present.
- Halve the opening to 50 km, then to 25 km, and walk the coast again each time.
- Multiply each step count by its opening. Plot the three lengths against the three openings on log-log graph paper.
- Rule a straight line through the points and measure its slope. Subtract the slope from 1 to get D for your map.
Next: Dragon Curve: Fold a Strip, Open to 90°, and a Stage Appears · Halve an A4 sheet and the shape stays the same, while a coast only roughly repeats: A4 Paper Size: Built So Each Half Keeps the Same Shape
Sources
- [1] Natural Earth, 1:10m Coastline (ne_10m_coastline), version 5.1.2, with its README and coastline notes; public domain. https://github.com/nvkelso/natural-earth-vector/tree/v5.1.2 Read: full text of the notes; the data file used in full. Text license: Public domain.
- [2] Original data for this page: divider walks with seven rulers, 200 km down to 3.125 km, around Great Britain's main island on Natural Earth v5.1.2 (method in the text); all seven results are in the CSV download. https://drawnmathematics.com/fractals/coastline-paradox/coastline-paradox-ruler-walk.csv Read: this page's own computation; method in the text, data in the CSV download.
- [3] Akhlaq Husain, Jaideep Reddy, Deepika Bisht and Mohammad Sajid, "Fractal dimension of coastline of Australia," Scientific Reports 11: 6304 (2021). https://doi.org/10.1038/s41598-021-85405-0 Read: full text; paraphrased, with short quotations. Text license: CC BY 4.0.
- [4] Benoit Mandelbrot, "How Long Is the Coast of Britain? Statistical Self-Similarity and Fractional Dimension," Science 156(3775): 636–638 (1967). https://doi.org/10.1126/science.156.3775.636 Read: abstract.
- [5] Rijksmuseum, Amsterdam, collection record RP-P-1937-1763: Kaart van Groot-Brittannië en Ierland (Christiaan Sepp, printmaker, after his own drawing; Isaak Tirion, publisher; Amsterdam, 1743). https://id.rijksmuseum.nl/200449030 Read: collection record (key facts).
- [6] Weisstein, Eric W. "Koch Snowflake." From MathWorld--A Wolfram Resource. https://mathworld.wolfram.com/KochSnowflake.html Read: used to check facts only; no text, figures or tables reproduced.
Cite this page
Drawn Mathematics. “Coastline Paradox: Seven Rulers, Seven Lengths for Britain.” Drawn Mathematics. Published 2026-10-26. https://drawnmathematics.com/fractals/coastline-paradox/ (accessed: add the date you read it).
How each drawing is checked: Checking the constructionCorrections and redrawsHow to reach us